
Credit unions and banks that use Excel for financial statement analysis have likely encountered the common pitfalls of the application: overwritten templates, broken formulas, and lack of transparency, just to name a few. Excel offers significant flexibility, but it is also easy to break. Solving these issues is beyond the scope of this article, but we will look to tackle them in a future discussion.
As part of our ongoing series on using Excel for financial statement analysis, we’re offering tips and tools loan analysts can use to improve your Excel-based financial statement spreading template, and in turn, optimize your loan analysis process. Instead of focusing on formulas in Excel, we’re highlighting six functions and tools you can use starting today. This includes not just how to set them up in Excel, but examples, too. Let’s dive in!
Building a Bank Financial Statement Analysis Template in Excel
Many community banks and credit unions lean on Excel or similar spreadsheet applications to perform spreading and tracking tasks. While some leave the details of the spreadsheet format up to individual loan analysts, other lending institutions strive for consistency and scalability by building spreading and tracking templates. The goal is to maintain the same format for all, no matter who is preparing or reviewing the loan.
Unfortunately, these templates aren’t always effective at their goal, and users often encounter some common problems that affect a bank’s financial statement analysis templates in Excel.
For community banks and credit unions that want to keep using Excel but are looking for a better way, much can be improved by adopting Excel template best practices – and a few relatively simple tricks we’ve learned along the way.
Supercharge your loan management with our Excel Template for Financial Statement Spreading. Download our free financial statement spreading templates now!

Six Tips to Improve Your Excel Template with Examples
These tips and tricks, provided below from basic to advanced, will help you streamline your financial statement spreading process and reduce errors.
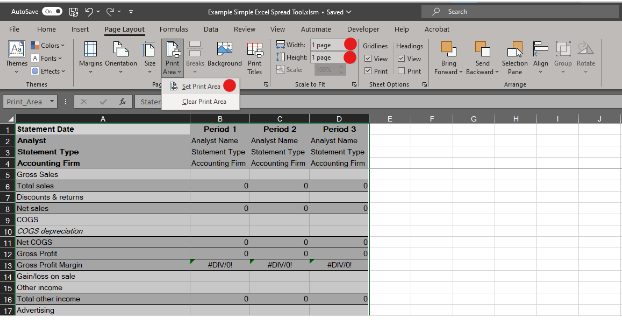
1. Set print area
How many times have you printed an Excel spreadsheet only to have two rows or the final column carry over onto a second page? Being able to see a lot of information at a glance is an essential aspect of spreading, so ideally, you want to have all the spreadsheet information print (or PDF) on one page.
There are two ways to do this:
- Set Print Area – Select the information you want to print on the spreadsheet with your mouse (from top-left to bottom-right), then go to the Page Layout header menu and select the “Print Area” option to set the print area. It will then ignore everything outside the print area and print just what you need to see.
- Scale to fit – Once you’ve set your desired Print Area, the Page Layout menu also has a Scale to Fit option: Choose the dimensions, such as one page wide by one page high. Excel will either shrink or expand the size of the information to fit the designated number of pages.
2. Freeze panes
Statement spreading worksheets can get very detailed and long, and after years of adding statements, can contain many columns as well. To keep column and row titles in view while scrolling, first, select the cell immediately below the Row you want frozen at the top, and immediately to the right of the Column you want frozen on the left. Then, go to the View header menu and select the “Freeze Panes” options.
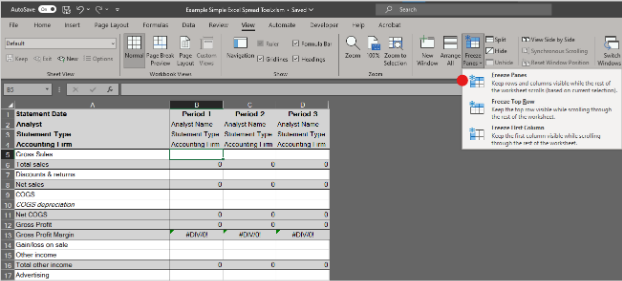
In the example above, Row 4 will continue to be visible as you scroll up and down, and Column A will continue to be visible as you scroll to the right.
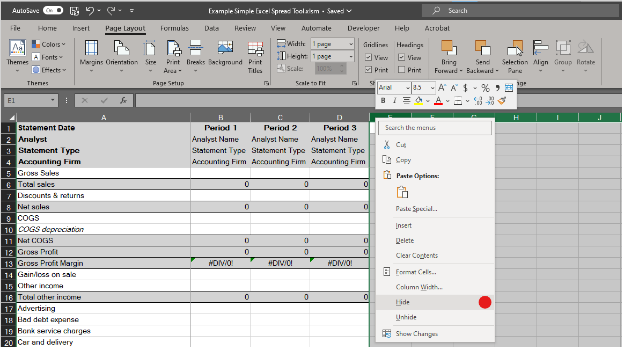
3. Hide empty space
Just as there is a lot of information within financial statement spreadsheets, there’s also often lots of whitespace, which can be distracting- especially to new analysts- and make a large gridded spreadsheet harder to read. If you’d like to improve the look and readability of your Excel spreadsheets, you can hide the empty space with a simple keyboard shortcut.
To hide empty space to the right of your data, click the header of the first empty column to the right of your last data column. This will highlight the entire column. Next, press CTRL+SHIFT+RIGHT ARROW, which highlights all columns to the right. Then right-click on any highlighted column header to pull up the menu and select “Hide.” The result? All columns without data will be hidden, leaving a grayed-out section, both on the screen and when you print.
The same can be achieved for rows below your data. Select the row header directly below the last row of data, key CTRL+SHIFT+DOWN ARROW, right click the row header and select “Hide”.
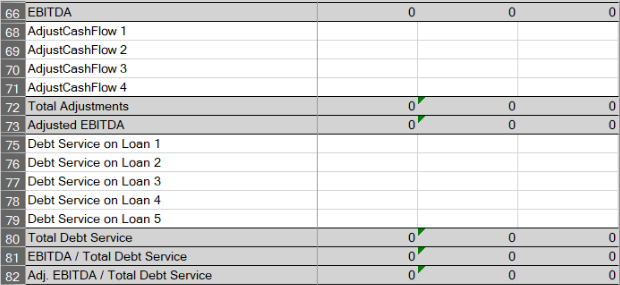
4. Dedicated adjustment panels
A common mistake made when creating financial statement spread templates is to include adjustments directly within cell formulas. For example, when an analyst directly inputs a +$10,000 adjustment into the EBITDA formula. While it’s correct in that one instance, it’s invisible to the end users, people viewing printed copies, and anyone else who copies that Excel spreadsheet as a template.
Instead, build a template with panels, or sets of rows, for documenting adjustments and other details, such as a section for debt service and adjustments to EBITDA. This provides more transparency to anyone reviewing the loan.
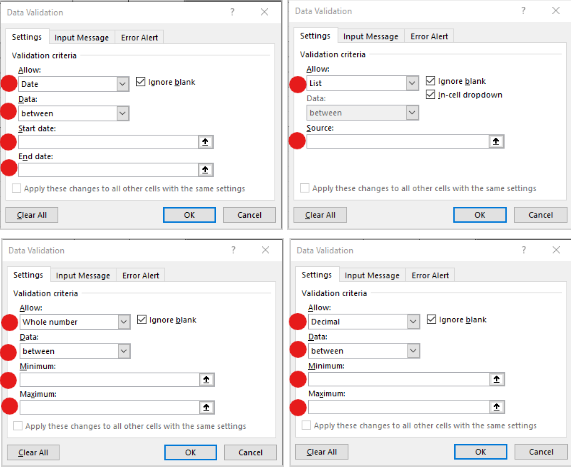
5. Data validation and dropdown menus
Data validation is an efficient way to ensure consistency in formatting and process. Go to the Data header menu and look for “Data Tools.” Within that section, you’ll find the icon for “Data Validation.” Clicking that brings up a panel that helps you set up parameters. Here are some examples of how you can use data validation:
- Indicate statement type - Using the “list” option under the data validation “allow” section, you can include items like “tax return” and “CPA prepared.” The “source” can either be entered directly or can refer to a range of cells in the workbook, allowing you to easily add new options to the list.
- Dates - Selecting the “date” option restricts the user from entering anything but a date into that cell. Dates can further be limited with Between, Greater than, Less than, and other controls.
- Data range - If you wish to restrict input options to only a set of numbers within a certain range, such as between one to 10 in a risk analysis spreadsheet, you can set that up in the data validation menu using either the “list” option or setting the validation to “whole number” and designating “between 1 and 10” or something similar.
- Number format - Perhaps you want to have only whole or positive, or negative numbers within a certain cell. Data validation settings can ensure the cells only accept certain values. Choosing “whole number” or “decimal” and then using the control options for Between, Greater than, or Less than will allow you to ensure users enter data in the format you require.
6. Protecting cells and sheets
To prevent overwriting essential data and formulas, Excel allows users to create password-protected locked cells. First, select the cells you want to lock. In the Home header menu, click “Format” under the Cells section. Then select “Lock Cell”- note that this will not have any effect unless you take the next step.
Next, select “Protect Sheet.” This will prompt you to create a password that must be entered any time you attempt to change the data within the protected cell or range.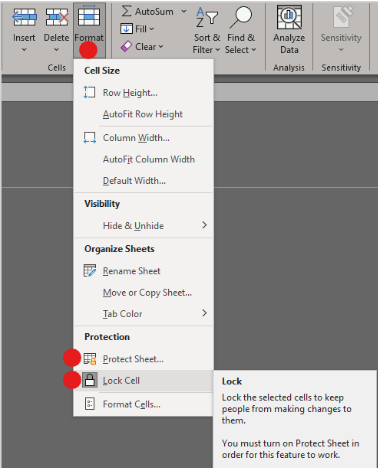
Even if you leave the password blank or provide it to all loan analysts, the password prompt will automatically give the user pause, helping prevent an inadvertent mistake. Think of it as an additional step that protects users from breaking your spreadsheet templates.
Applying this protection to formula cells, for example, will ensure that users cannot make edits to the underlying formulas and will maintain the integrity of the spreadsheet’s calculations, but keep in mind that you will need to provide alternative methods to accomplish their purposes, if users have legitimate reasons for these changes. Suggestion 4 above provides an example.
Financial Statement Analysis Beyond Excel
Excel is an effective tool for financial statement analysis if you know how to use advanced features and formulas. While some loan analysts have that skill set, others may not know all the functions and formulas. This slows the review process and can lead to errors if Excel formulas and functions are used incorrectly or modified in unintended ways.
For community banks and credit unions looking to scale and streamline their loan review process, financial statement spreading software may be the answer. For example, FISCAL Forward was designed specifically for smaller lending institutions, with many of the flexibility and customization options you like in Excel, but with safeguards and consistent templates to prevent the common pitfalls that come with spreadsheet processes.
Whatever your platform, consistency and accuracy are top priorities. Using transparent documentation and financial statement analysis best practices will set you on the path toward efficiency and growth.